
Copilot and AI Enhancements
- Measure descriptions written by Copilot Copilot can now generate clear descriptions for measures. Instead of relying only on measure names, users get plain-language explanations, making reports easier to understand.
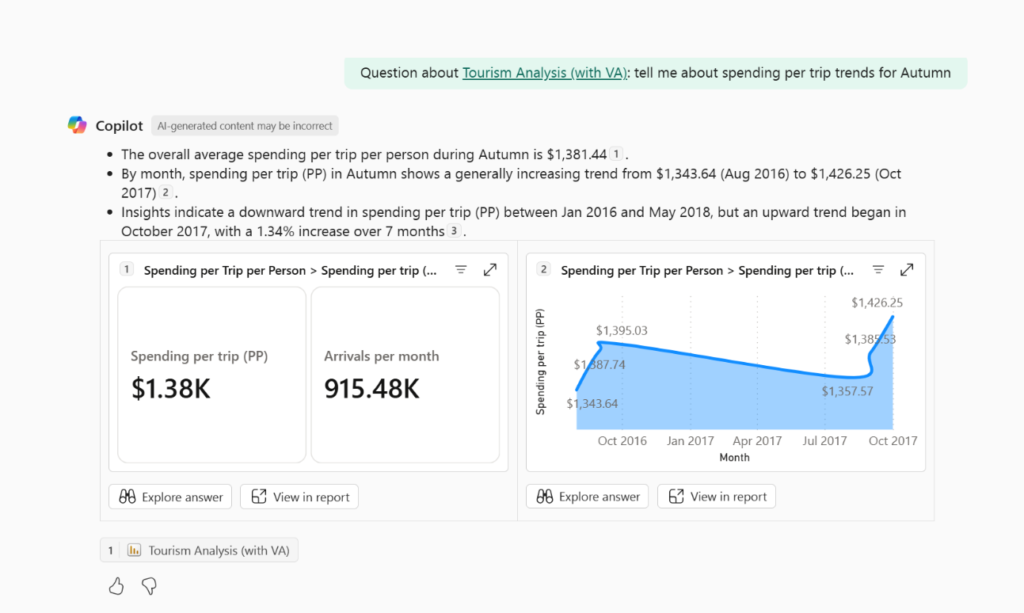
- Filtered report summaries in Copilot Copilot’s standalone summaries now respect filters, so if you ask about “sales in 2024,” the response applies only to that slice of data.
Modeling Enhancements
- Edit data models directly in the Power BI Service Small but important model changes can now be made in the Service without switching back to Desktop.
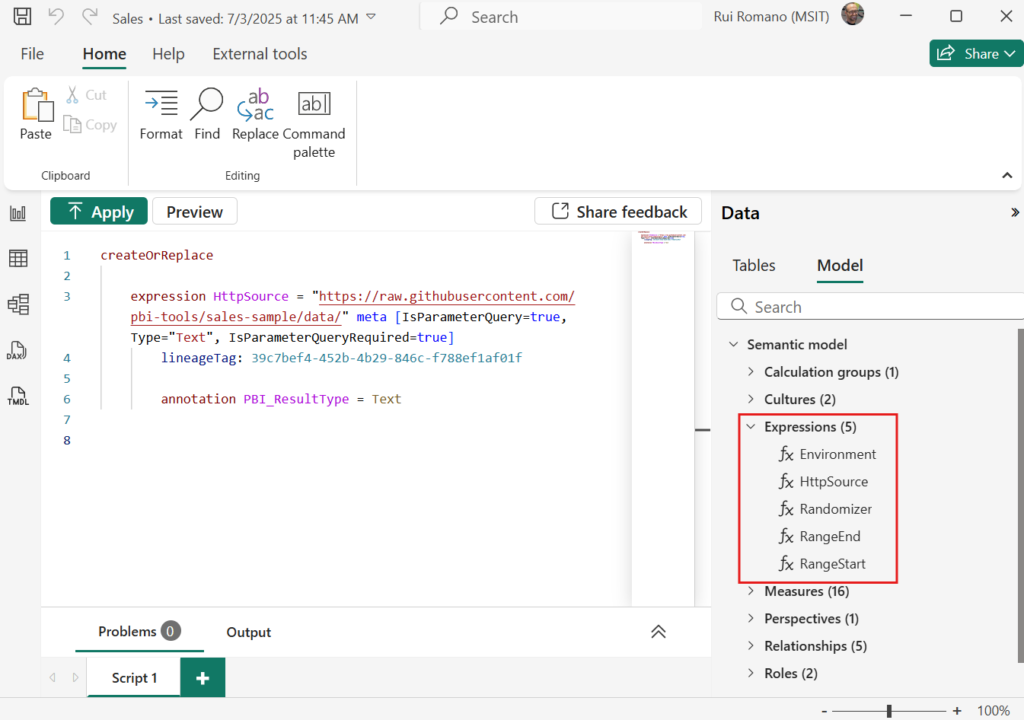
- TMDL view enhancements Tabular Model Definition Language is now more readable, making it easier to maintain complex models.
- Mirrored Azure Databricks catalog for Direct Lake Provides better integration between Fabric and Databricks data, supporting Direct Lake performance.
- Semantic model refresh templates with Fabric Data Pipelines Standardizes refresh processes, reducing errors and speeding up automation.
Data Connectivity
- Impala Connector 2.0 (Preview) Faster and more reliable queries for Impala sources.
- Entrald authentication for PostgreSQL Stronger security and compliance for PostgreSQL connections.
Developer and API Updates
- Simplified PBIP file format for Live Connect reports Developers working with source control now have a cleaner structure for report files, which simplifies collaboration.
Visualizations
New visuals in AppSource include:
- Drill Down Line PRO by ZoomChart for interactive trend analysis
- Date Picker by Powerviz for easier filtering
- Download Button by JTA for exporting report content
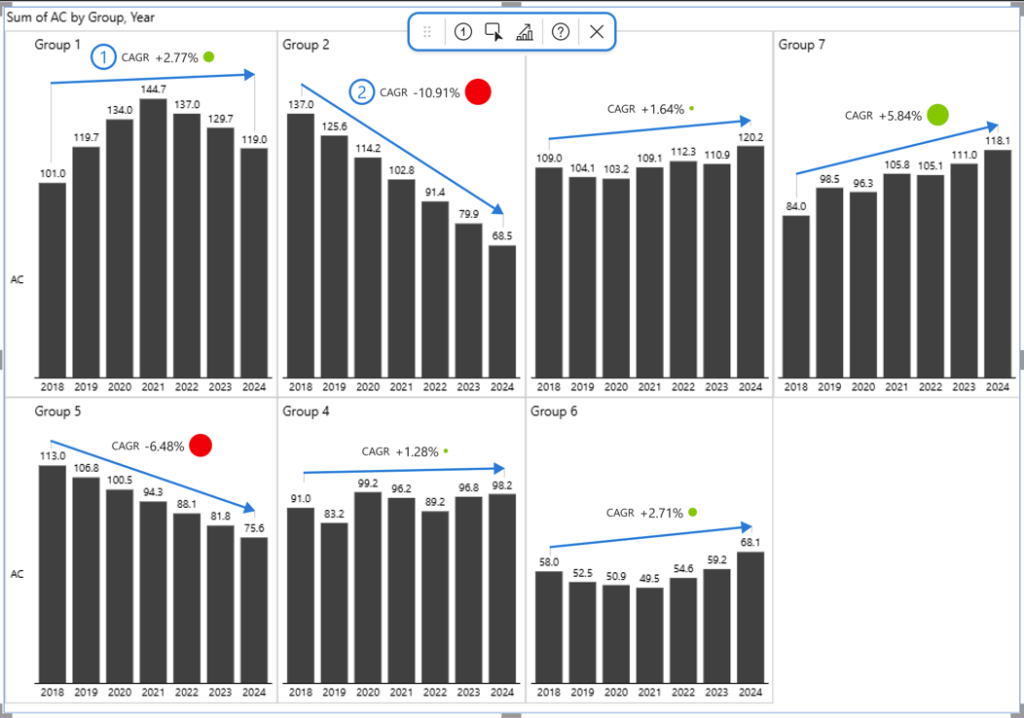
- CAGR Arrows in Zebra BI Charts for financial analysis
Conclusion
The newest Power BI updates show a clear focus on simplicity: fewer steps to build calculations, smarter visuals that explain themselves, and stronger data connections. Together, they reduce manual work and make reporting more reliable.
And to keep up with the most practical updates across Power BI, Excel, Python, and AI, subscribe to our newsletter.