1. The Excel Era: Where Most BI Journeys Begin
Excel has been the go-to analytics tool for years. Whether you’re building dashboards, crunching numbers, or crafting reports, Excel handles it all.
But as you deal with:
- larger datasets
- recurring report schedules
- and increased collaboration demands
you may start to feel the pinch: performance issues, version confusion, and time-consuming manual work.
Excel doesn’t fall short. It simply wasn’t built for real-time, multi-source dashboarding. 😉

2. Power BI Isn’t a Replacement
Power BI brings to the table:
- Live data connections across sources
- Automatic refreshes and scheduled updates
- Interactive visuals and drilldowns
- Cloud sharing and centralized access
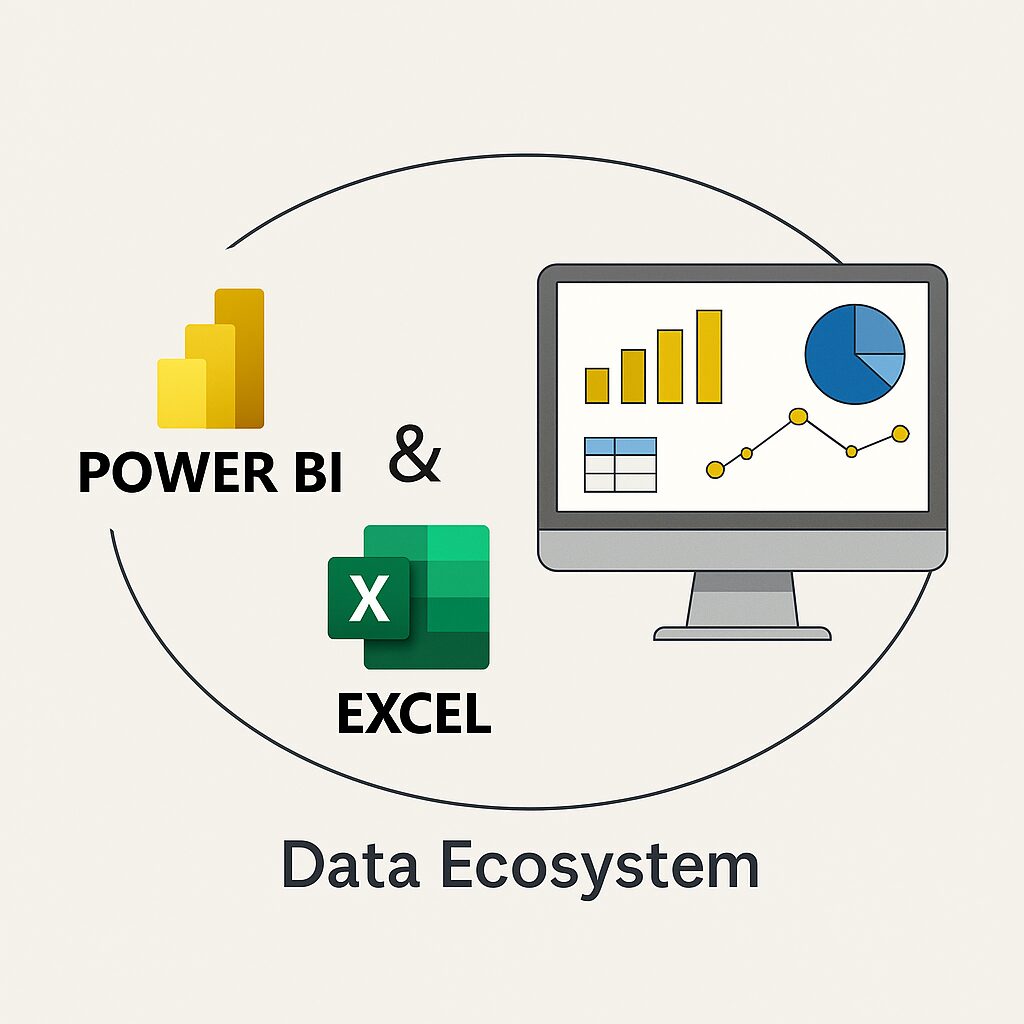
But here’s what’s important: you don’t stop using Excel. In fact, Power BI complements Excel beautifully. You can connect your Excel files to Power BI and even analyze Power BI datasets inside Excel.
It’s not about leaving Excel but it’s about unlocking a bigger ecosystem.
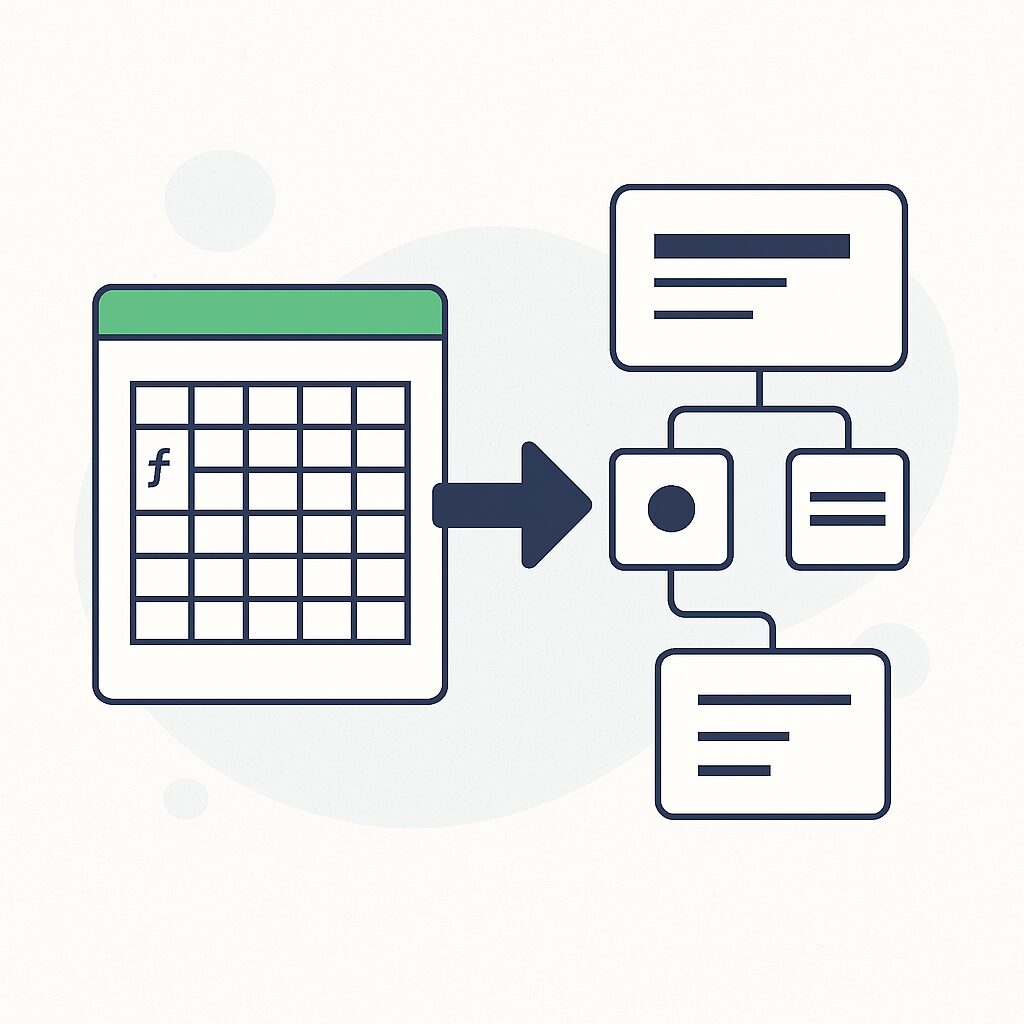
The Mindset Shift: From Sheets to Models
One of the biggest changes when moving to Power BI is how you think about your data:
- You move from cell-based logic to data models.
- Instead of formulas everywhere, you use DAX measures and calculated columns.
- You stop using multiple sheets for different views and start using filters and slicers.
- You understand how relationships replace VLOOKUPs and joins.
This shift feels odd at first but once you get it, things click. 😉

4. Features Excel Users Often Overlook in Power BI
If you’re used to Excel’s flow, here are some Power BI gems worth exploring:
- Power Query Editor: Like Excel’s data cleaning, but way more powerful and automated.
- Drillthrough filters: Let users click on a chart and instantly zoom into details.
- Bookmarks: Create multiple report views without duplicating pages.
- Q&A feature: Let users ask questions using plain language (e.g., "show sales by region").
These features don't just save time, they elevate your entire analysis experience.
5. Common Mistakes When Transitioning to Power BI
Many Excel pros face the same hurdles:
-Trying to replicate every Excel technique instead of learning new ones
-Ignoring the data model and building visuals on raw tables
-Overloading visuals instead of using navigation
The fix? A bit of unlearning, a bit of experimenting and suddenly you’re building cleaner, smarter dashboards than ever before.
Conclusion
Excel will always be the most versatile spreadsheet tool but when it’s time to consolidate multiple data sources, create scalable dashboards, and share interactive reports, Power BI steps in as the right companion.
You’re not switching lanes but building a bigger road. The real journey isn’t Excel vs. Power BI. It’s learning how they work together to take your Business Intelligence game to the next level.
Want to learn more about Excel and Power BI? Subscribe to our newsletter for hands-on tips, real-world use cases, and smart BI strategies tailored for professionals like you.