
Introduction
May 2026 brings meaningful changes across four areas: Copilot becomes more accessible for everyday report consumers, several reporting features move out of preview, version control arrives in Power BI Desktop, and the Get Data experience gets a complete redesign. Here is what each one means in practice.
Copilot Got More Useful This Month
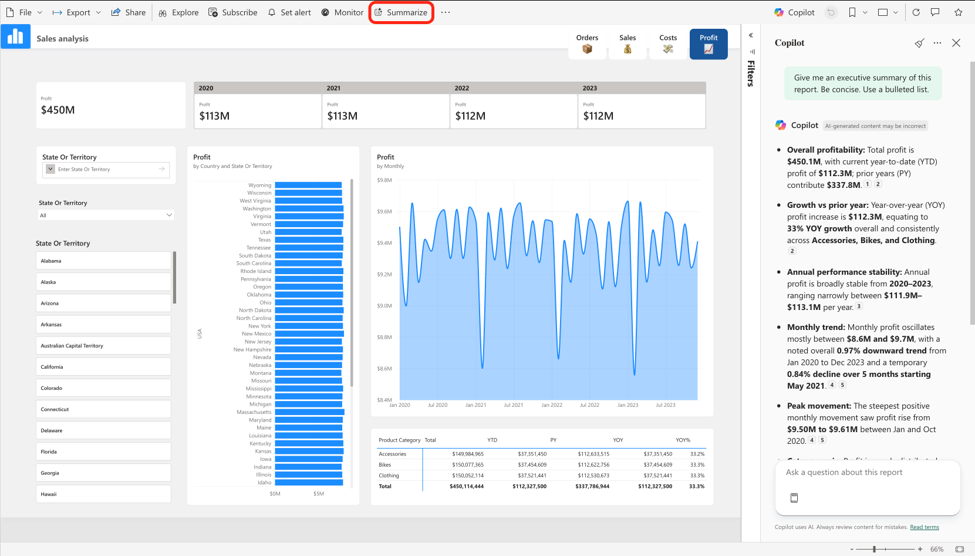
Summarise shortcuts on the ribbon and visual header
A new Summarise button on the report ribbon generates a report-wide summary covering key trends, performance highlights, and notable changes across all pages and visuals. The same feature is now available on individual chart headers. One click produces a visual-level summary calling out trend shifts, category differences, and key drivers of change, without requiring users to manually interpret every data point.
Explore improvements
Explore now supports perspectives. Report authors can give consumers a focused, filtered list of tables and fields from a large data model rather than exposing the entire model, making navigation significantly easier for non-technical users.
Matrix visuals in Explore now auto-expand when fields are added or reordered, so newly added fields are immediately visible. Users can show or hide totals directly from the Explore toolbar. Formatting applied to a matrix in a report also carries over when users launch an exploration from it.
Copilot Narrative visual now embeds in customer applications (Preview)
The Copilot narrative visual can now be embedded in customer-facing applications where report consumers do not need to sign in. Previously, this was limited to signed-in or secure embed scenarios only, which restricted where narrative summaries could be deployed.
Reporting Features Now Generally Available
Visual calculations and custom totals
Report authors can now add running sums, moving averages, percent of parent, and other calculations directly to a visual without writing DAX measures. Custom totals now include None and Average alongside the existing Sum, Min, Max, Count, and Count Distinct options. Right-click any numeric column in a table or matrix to customise how the total row is calculated.
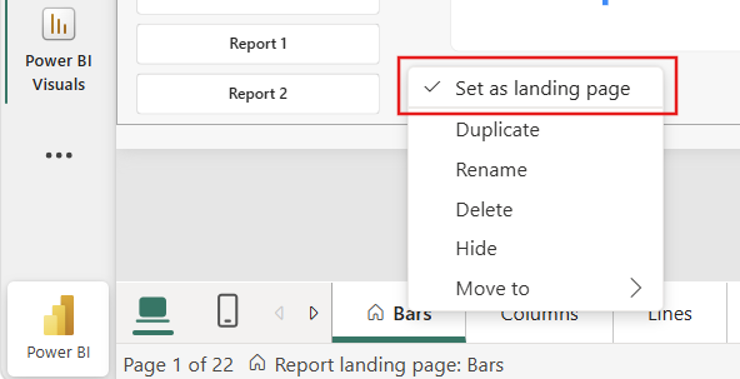
Set as a landing page
Any page in a report can now be designated as the landing page, ensuring viewers always open on the right starting point. Previously, authors had to manually navigate to the correct page before publishing. The setting is available by right-clicking a page tab or through the page formatting pane.
Default format string locale
A new report-level setting allows dates and numbers to display consistently for all viewers regardless of their individual browser settings. Useful for organisations where consistent formatting across regions or teams matters.
Column fixed and default width
Authors can now specify exact pixel widths for columns in table and matrix visuals, either per column or as a default applied to all. Widths can be configured separately for desktop and mobile views.
Lists in text boxes now preserve formatting correctly, indentation renders as expected, and bulleted lists can be pasted directly from Word without losing structure.
Two New Features Worth Watching
Version History in Power BI Desktop
Version History is now available for Power BI files saved to OneDrive or SharePoint. Authors can view previous versions directly in Desktop, open older versions in a separate window for comparison, and work from an earlier version without overwriting the current file. Access it from the top left flyout in Power BI Desktop. The file must be saved to OneDrive or SharePoint with the Save and Share option enabled.
Subscriptions for reports in org apps (Preview)
Report consumers can now create and manage email subscriptions for Power BI reports directly within org apps. Scheduled email snapshots and report links are now available to org app viewers, closing a gap that previously required users to access reports outside of org apps to use this feature.
Conclusion
May 2026 is a practical release month. Most updates share the same theme: removing manual steps from everyday reporting work. Copilot summarises instead of requiring manual interpretation. Landing pages remove pre-publish navigation. Version History removes the risk of losing earlier work. Custom totals and visual calculations reduce dependency on DAX for common reporting tasks.
The pattern is consistent. Power BI is handling more of the repetitive work, so analysts can focus on the decisions the data is pointing toward.
If you want Excel & Power BI monthly updates like these in your inbox, subscribe to the newsletter.