
Introduction
Most Power BI updates feel incremental.
Small UI changes. Minor features. Things you rarely use.
But this release shows a different direction.
Power BI is slowly moving from:
- Static dashboards
- Manual analysis
To:
- Interactive workflows
- Action-based reporting
Before we get into March, it helps to look at where things were last month.
Power BI Is Moving From Reports to Action Systems
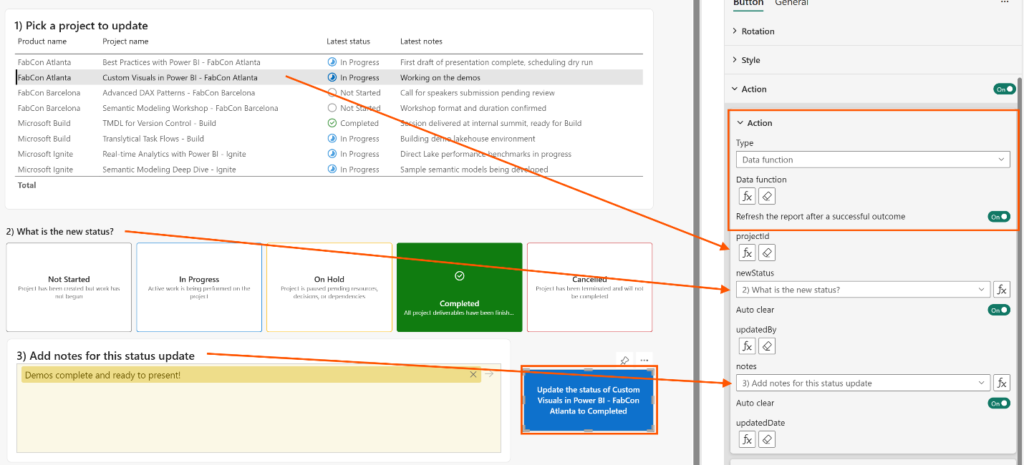
Translytical Task Flows
Power BI now allows users to take actions directly inside reports.
You can:
- Update records
- Add new data
- Trigger workflows in other systems
- Call external APIs
All without leaving the report.
This changes how reports are used.
Instead of:
Looking at data → switching tools → taking action
You now:
View data → act immediately
Why this matters
This is one of the most important updates in this release.
It turns Power BI into:
- A decision layer
- Not just a reporting layer
Where does this fit in real work
- Sales teams updating deal status directly
- Operations teams fixing data without going back to source systems
- Approvals triggered from dashboards
AI Inside Reports Is Becoming More Useful
AI Narrative Auto Refresh
Previously, AI-generated summaries required manual refresh.
Now, they update automatically when slicers change.
Why this matters
- Saves time during exploration
- Keeps summaries aligned with filters
- Reduces friction in interactive reports
Practical use
If your dashboard is used for:
- Monthly reviews
- Executive summaries
- Dynamic filtering
This becomes immediately useful.
Data Modeling Is Becoming More Scalable
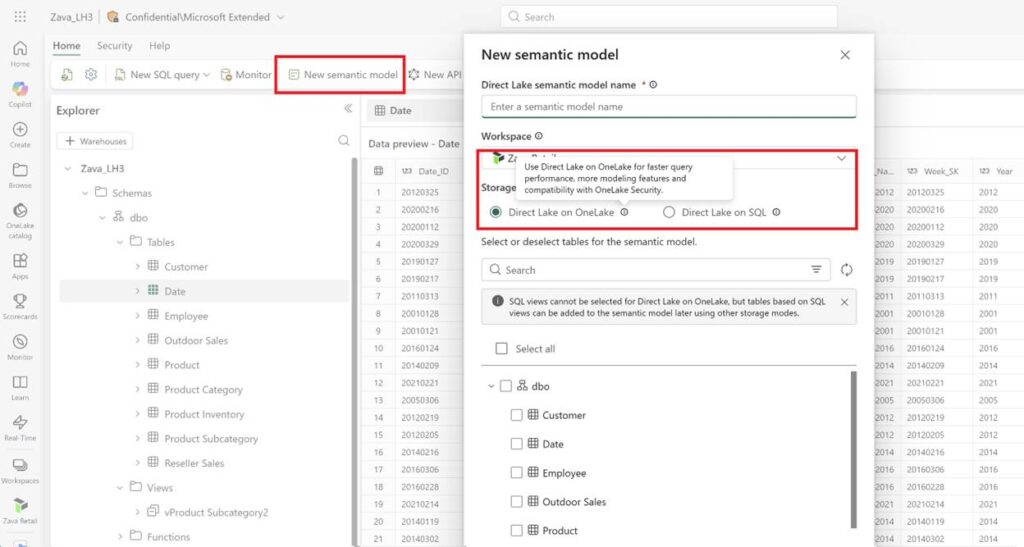
Direct Lake in OneLake
This removes the need for frequent data refreshes by allowing direct querying.
Why this matters
- Faster performance on large datasets
- Less duplication of data
- Simplifies architecture
Practical impact
For teams working with large data volumes:
This reduces:
- Refresh delays
- Data movement overhead
DAX User-Defined Functions
You can now create reusable DAX functions.
Why this matters
- Reduces friction in interactive reports
- Improves consistency across reports
- Makes models easier to maintain
Practical impact
Instead of rewriting the same logic multiple times:
You define it once and reuse it.
This is especially useful in:
- Large enterprise models
-Standardized reporting systems
Report Logic Is Getting More Flexible
Custom Totals
Power BI now allows custom logic for totals in tables and matrices.
Why this matters
Default totals often confuse users, especially for:
- Averages
- Counts
- Non-additive measures
Custom totals let you control how totals are calculated without rewriting DAX.
Important limitation
This does not replace proper DAX modeling.
It is a layer of flexibility, not a foundation.
Reports Are Becoming More Interactive
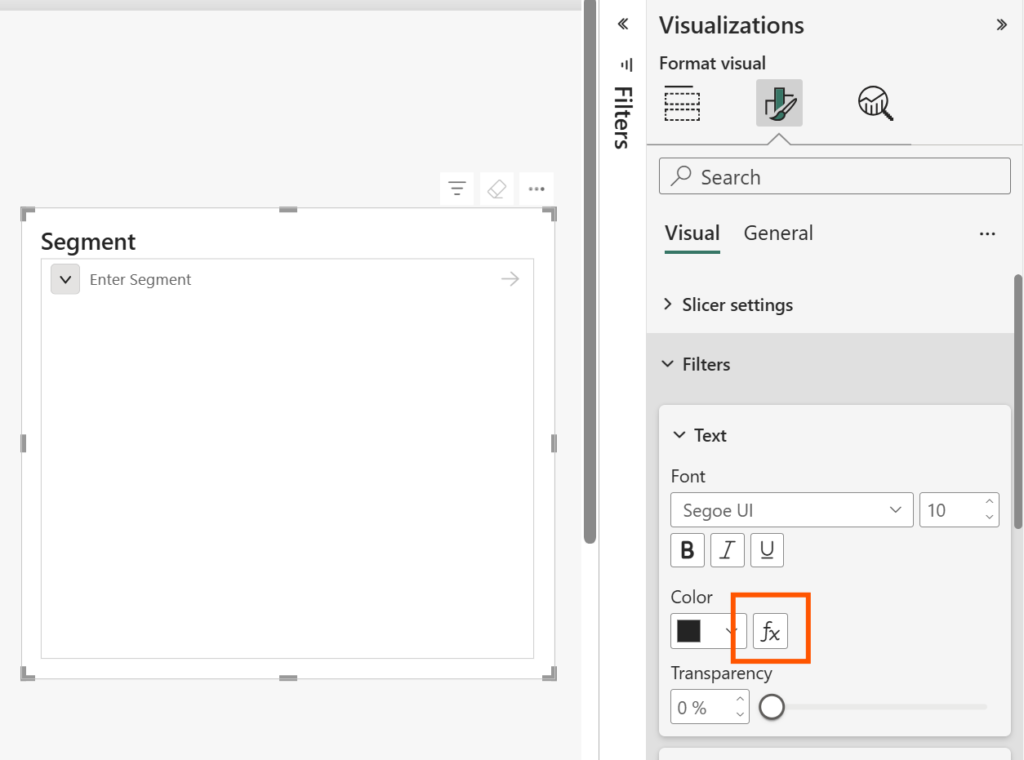
Input Slicer Conditional Formatting
Slicers can now respond visually to data conditions.
Why this matters
- Improves usability
- Adds visual feedback
- Helps guide user interaction
Practical use
You can:
- Highlight important selections
- Show status changes
- Guide user decisions visually
What This Means for Power BI Users
This update is not about one feature.
It is about direction.
Power BI is moving toward:
- Action driven reporting
- Real time interaction
- Reduced manual work
For professionals:
- Use Translytical flows when actions are part of reporting
- Use AI narratives for dynamic summaries
- Use DAX functions to standardize logic
- Use Direct Lake for large scale data
Conclusion
The March 2026 update does not introduce a single standout feature.
But it quietly improves how Power BI is used in real workflows.
- Less switching between tools.
- Less repeated logic.
- More interaction inside reports.
These are the changes that matter over time.
If you want to stay updated on the biggest changes that actually impact reporting workflows, consider subscribing to the newsletter.