

What is Data Visualization?
At its core, data visualization is the art and science of presenting data in graphical form, using charts, graphs, and maps. It acts as a bridge between technical and non-technical stakeholders, translating complex numbers into visuals that everyone can grasp.
The Power of Data Visualization
Data visualization isn't merely a translation tool; it's a spotlight that reveals trends, patterns, and outliers that text-based data might conceal. This enhanced visibility accelerates decision-making and empowers businesses to navigate the sea of data they collect.
The Underrated Nature of Data Visualization
Despite its significance, data visualization often takes a back seat to complex data modeling techniques and AI. This misconception arises from the belief that it's just about making data look pretty. In reality, effective data visualization requires a deep understanding of data, selection of the right visualization techniques, and skillful communication.
The Influence of Data Visualization in Business Analytics
Data visualization simplifies complex data, democratizes insights for all stakeholders, and speeds up decision-making. It's also pivotal in predictive analytics, helping businesses anticipate market changes.
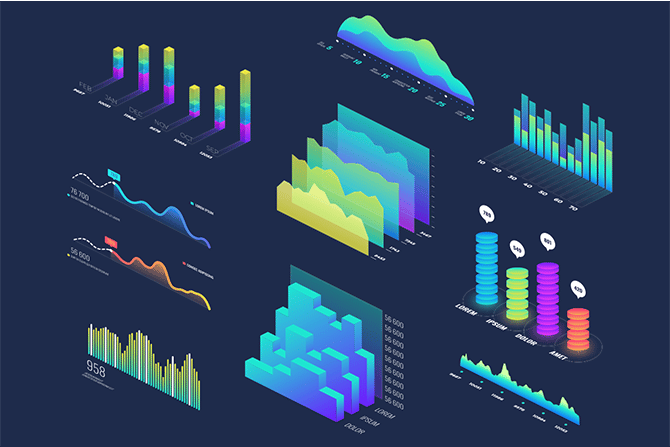
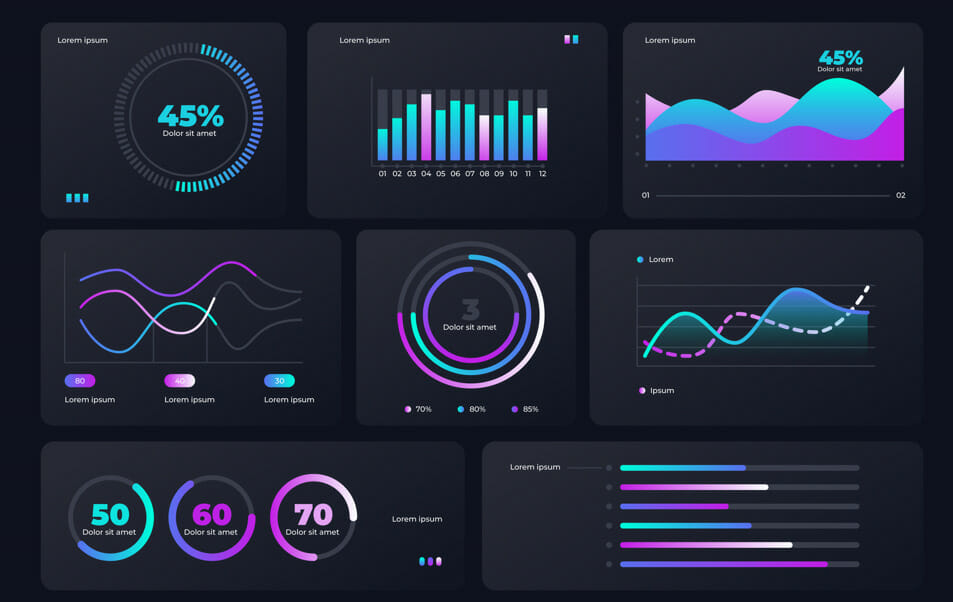
Data Visualization Techniques
Let's take a closer look at data visualization techniques, where we turn raw data into easy-to-understand visuals. These techniques are like different tools in our toolbox:
1. Bar Charts and Column Charts: These are like simple tools for comparing numbers in different groups. They help us see trends over time or differences between categories.
2. Pie Charts: Think of pie charts as a way to show how parts make up a whole. They help us understand proportions in a simple way.
3. Line Graphs: Line graphs are great for showing how things change over time. They're useful for seeing patterns and predicting future trends.
4. Scatter Plots: These are like maps that show the relationship between two numbers. They help us understand how two things are connected.
5. Heat Maps: Heat maps use colors to show where things are happening the most. They're good for finding patterns in a big set of data.
6. Interactive Dashboards: Imagine a dashboard in a car. These interactive dashboards bring all the important information together in one place. They let you play with the data, so you can see what's important to you.
7. Geographical Maps: These maps help us see information on a map. They're useful when we're talking about places and want to compare things in different areas.
These techniques are just some of the ways we can make data easier to understand. Learning these skills will help you turn data into clear and engaging visuals that everyone can understand.

The Future of Data Visualization in Business Analytics
As we embrace Big Data and AI, data visualization will continue to evolve. Augmented and virtual reality will bring three-dimensional visualizations to life. AI will automate data analysis and visualization, saving time and enhancing efficiency.
In business analytics, data visualization is an underappreciated yet powerful skill. It simplifies data, making it accessible to everyone, and its future looks promising in an era dominated by Big Data and AI. Mastering this skill today is an investment in a successful future in the dynamic landscape of business analytics.

