Excel

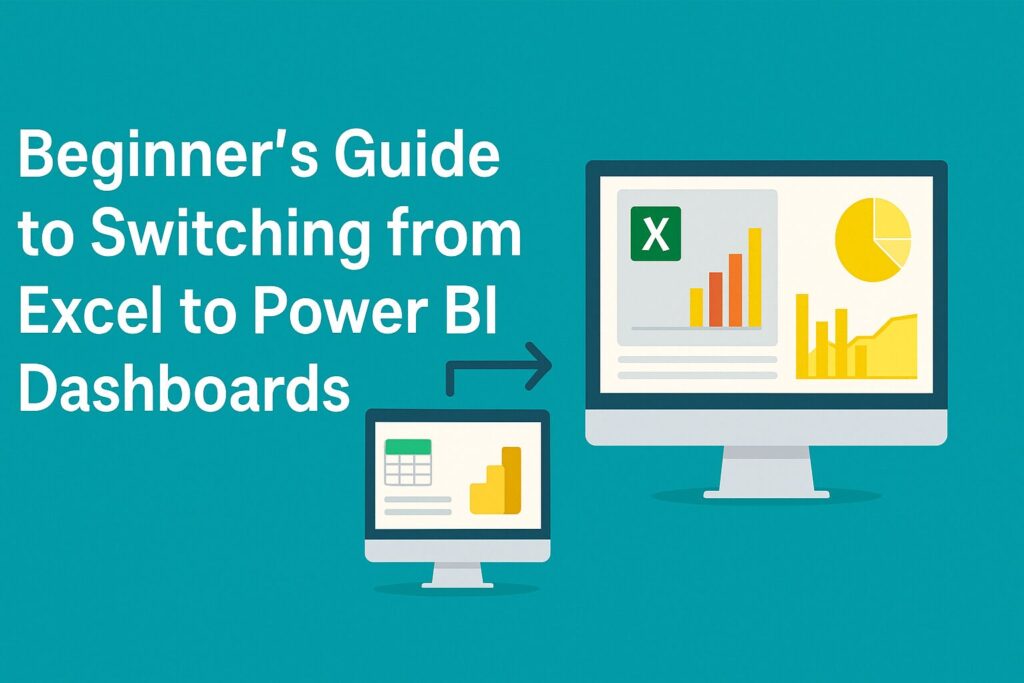
Beginner’s Guide to Switching from Excel to Power BI Dashboards

Beginner’s Guide to Switching from Excel to Power BI Dashboards

If you’ve ever juggled 15 Excel files, 10 pivot tables, and 5 charts just to answer one client’s question then you’re not alone. Many professionals begin their data journey in Excel, and for good reason: it’s powerful, familiar, and flexible. But as your data grows and reporting needs scale, Power BI becomes a natural next step and not a replacement, but an evolution.

Let’s walk through the journey from Excel to Power BI, the mindset shift it involves, and how to make the most of both tools together.

Beginner’s Guide to Switching from Excel to Power BI Dashboards Read More »

Say Goodbye to Manual Rules: How Copilot Transforms Conditional Formatting in Excel

Say Goodbye to Manual Rules: How Copilot Transforms Conditional Formatting in Excel

Conditional formatting in Microsoft Excel is a powerful feature that allows users to automatically apply formatting such as colors, icons, or data bars to cells based on specific criteria. This capability enhances data visualization, making it easier to identify trends, outliers, or key insights at a glance. However, setting up complex conditional formatting rules can be time-consuming and requires a good understanding of Excel’s functionalities. Enter Copilot, an AI-powered assistant integrated into Excel, designed to simplify and expedite this process.

Say Goodbye to Manual Rules: How Copilot Transforms Conditional Formatting in Excel Read More »