
What is the Smart Narrative Visual?
The Smart Narrative Visual is a feature in Power BI that uses AI to create narrative descriptions of your data. Instead of just showing numbers and charts, this visual generates text that explains what the data means, highlighting trends, anomalies, and key points. This helps users quickly understand and share insights without needing to dive deep into the data.
- Automatic Insights: The visual provides instant, automated text summaries of your data.
- Customizable: You can edit and customize the generated text to better fit your needs.
- Dynamic Updates: As your data changes, the narrative updates automatically.
Why Smart Narratives Are Gaining Popularity
As data becomes more central to decision-making, the ability to quickly and clearly communicate insights is critical. Here are some reasons why Smart Narratives are becoming more popular:
- Time-Saving: Instead of manually writing summaries, Smart Narratives automatically generate them, saving you time and effort.
- Improved Communication: By turning data into plain language, Smart Narratives make it easier for non-technical stakeholders to understand the insights.
- Consistency: Ensures that everyone is on the same page by providing a consistent interpretation of the data across the organization.
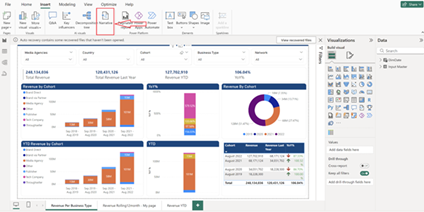
How to Use the Smart Narrative Visual
There are a few simple ways to start using the Smart Narrative Visual in Power BI:
1.Right-Click to Summarize:
- Right-click on any visual you want to summarize.
- Select “Summarize” from the menu.
2.Insert from the Visualizations Pane:
- Click on an empty area of your report.
- Go to the Visualizations pane on the right side.
- Select the Smart Narrative Visual to add it to your report.
Here’s how to get started:
- Grab the Smart Narrative Visual:
- Open the Visualizations pane and choose the Smart Narrative Visual to insert it into your report.
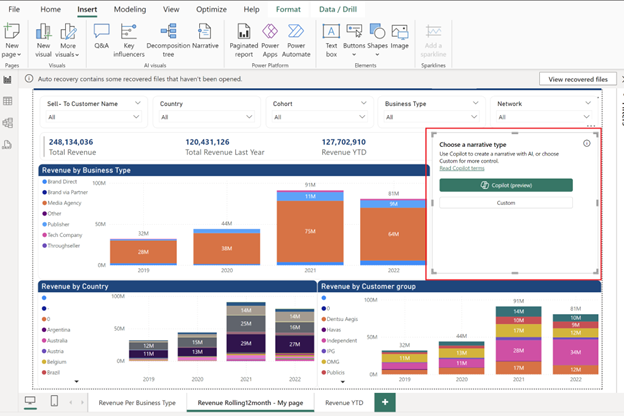
- Co-pilot Integration (If Available):
- If you have Co-pilot enabled, you’ll see an option for Co-pilot under the preview features, which can provide additional assistance with generating narratives.
Requirements for Using Co-pilot in Power BI
To use Co-pilot in Power BI, make sure you have the following:
- Co-pilot Enabled: Your administrator must enable Co-pilot in Microsoft Fabric.
- Capacity License: You need a capacity license, which is available in specific regions.
- Service Configuration: Your Power BI service should meet all necessary requirements for Co-pilot.
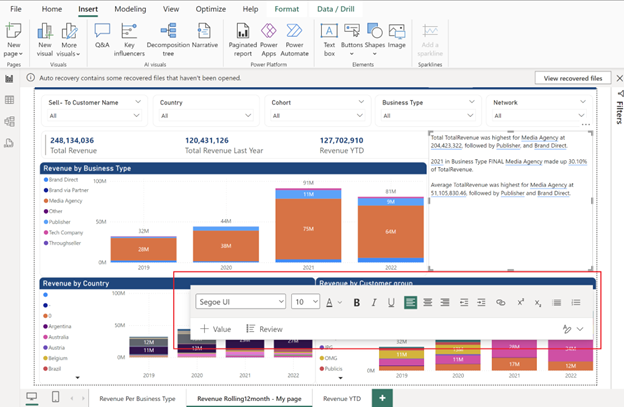
Customizing the Smart Narrative Visual
One of the great things about the Smart Narrative Visual is how easily you can customize it:
- Add New Measures or Fields: Enhance your narrative by adding specific measures or fields that are important to your report.
- Format Text and Values: Adjust the text, currency, and other values to align with your report’s style and make it look professional.
- Save and Rename Values: Rename and save values to make the narrative clearer, more readable, and relevant to your audience.
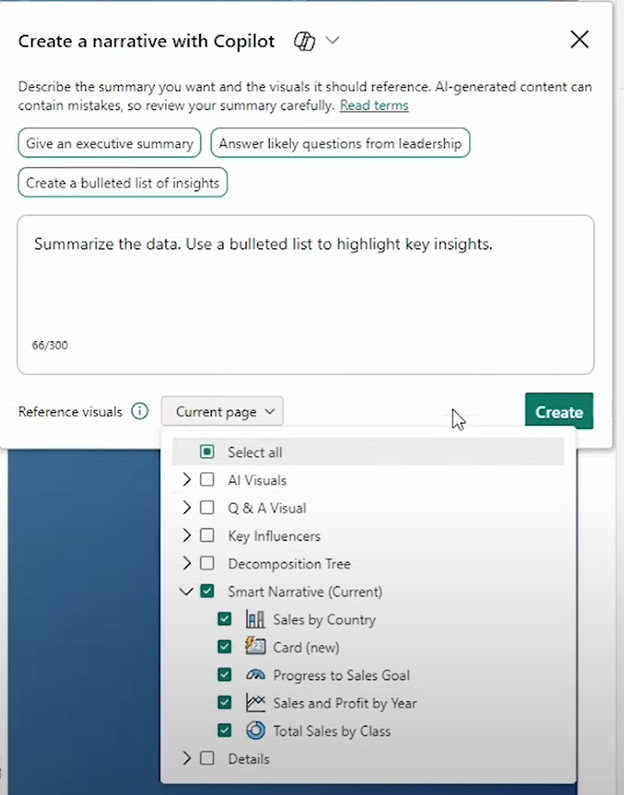
Leveraging Co-pilot for Smart Narrative
If you have access to Co-pilot, it can make generating summaries in Power BI even easier by using your report visuals. Here’s how you can use it:
- Enable Co-pilot: When you insert the Smart Narrative Visual, select the Co-pilot preview option.
- Get Suggestions: Co-pilot will offer suggestions, like creating a bulleted list of insights or generating an executive summary.
- Generate and Customize: Choose a suggestion, and Co-pilot will create the summary for you. You can then customize it to fit your needs.
For example, Co-pilot can highlight key insights, such as identifying the country with the highest or lowest sales, or showing the relationship between sales and profit trends. You can easily modify these insights and footnotes to better suit your narrative.
Editing and Modifying Generated Summaries
After generating a summary, you can:
- Adjust the narrative content.
- Spotlight the narrative to start your report with key insights.
- Edit or remove generated summaries to better fit your analysis.
Remember, to use Co-pilot-generated narratives, your Power BI workspace must have a premium or higher capacity license.
Conclusion
The Smart Narrative visual is changing the way we interact with data. By making insights more accessible, enhancing storytelling, and allowing for customization, it’s helping businesses make better decisions faster. As more organizations adopt this tool, we can expect to see even more innovative uses and integrations, making Power BI an even more powerful platform for data reporting.
Subscribe now to get the latest Python/Power BI/AI tips, and updates that are easy to understand and apply. .