
What Are Calculation Groups?
Calculation Groups in Power BI are a powerful feature that allows you to apply predefined calculations to existing DAX measures in your data model. They simplify creating and managing consistent, reusable calculations across multiple measures and reports. This makes your data models more efficient and reduces the need to duplicate logic, enhancing both consistency and maintenance. By using Calculation Groups, you can dynamically change the context of measures, such as switching between different time periods or aggregations, making your reports more versatile and dynamic.
Prerequisites
Before creating Calculation Groups in Power BI, ensure you have the following:
1.Updated Power BI Version: Make sure your Power BI version is updated to a release from November 2023 or later.
2.Enable Calculation Groups: Turn on the Calculation Groups feature in the preview settings. Remember to restart Power BI after enabling this feature.
Once these prerequisites are met and you have some measures in your data model, you are ready to start creating Calculation Groups.
Accessing Model View and Creating Calculation Groups
To create Calculation Groups in Power BI, follow these steps:
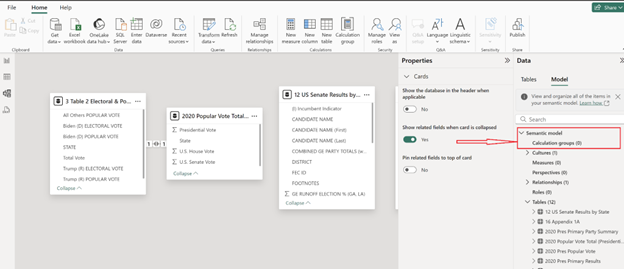
1.Open Model View: Click on the third icon from the top on the left-hand side.
2.Switch to Model Section: Ensure you are in the Model section by selecting it from the data pane.
3.Select Calculation Groups: Under the Semantic Model, find and select Calculation Groups.
Here, you’ll see an option to create a new Calculation Group. Click on + New Calculation Group to get started.
Naming Calculation Group and Column
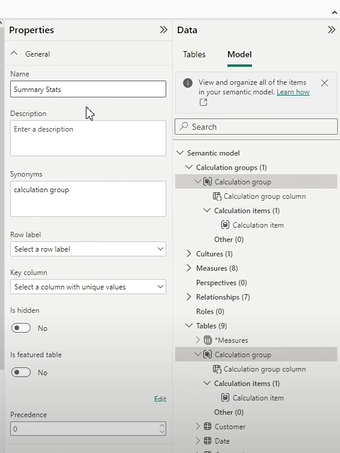
- Calculation Group Name: Double-click on the newly created group and name it, e.g., “Summary Stats.”
- Calculation Group Column: Name the column that will appear in your data pane, e.g., “Aggregation.
Defining Calculation Items
Next, let's define some calculation items for our Calculation Group. We'll start with basic summary statistics such as:Sum, Average, Minimum, and Maximum.
1.Sum Calculation Item:
- In the DAX formula bar, use the following code: Sum = SUMX(VALUES('YourTable'), [Selected Measure])
- Replace ‘YourTable’ with your actual table name.
2.Average Calculation Item:
- Paste the same formula and modify it: Average = AVERAGEX(VALUES('YourTable'), [Selected Measure])
3. Minimum Calculation Item:
- Again, paste the formula and change it: Minimum = MINX(VALUES('YourTable'), [Selected Measure])
4. Maximum Calculation Item:
- Modify the formula for the maximum calculation: Maximum = MAXX(VALUES('YourTable'), [Selected Measure])
Copying and pasting your DAX formulas will speed up the process, especially when creating multiple similar calculation items.
Testing Calculation Groups in Report View
After creating your Calculation Groups, it's time to test them in the Report View:
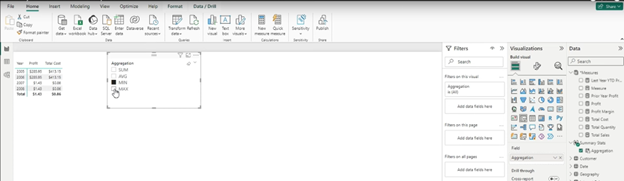
1.Create a Matrix Visual: Add measures like Profit and Total Cost.
2.Add a Slicer Visual: Link it to your Calculation Group.
3.Test Calculations: Use the slicer to switch between Sum, Average, Minimum, and Maximum to see how your data changes dynamically.
Conclusion
Calculation Groups are a powerful feature in Power BI, allowing for consistent calculations across different measures. They save time, reduce errors, and streamline your data models. By using Calculation Groups, you can easily manage and apply common calculations, enhancing the efficiency and accuracy of your reports.
If you found this introduction helpful and want to deepen your knowledge, consider exploring my course on Power BI training for more detailed insights and practical applications.
Stay ahead with the latest Power BI updates! Subscribe our newsletter for exclusive insights!