What is Power BI Drillthrough?
Drillthrough in Power BI is a feature that lets you dive deeper into a specific segment of your data directly from one report to another dedicated page. This capability is invaluable when you need to focus on a particular area such as a customer, supplier, or manufacturer, offering a detailed view that complements the broader data presented in your main reports.

Setting Up Power BI Drillthrough
Here’s a simple guide on how to use the Drillthrough feature:
- Initial Setup: Before you can drill through, you need to set up your reports in Power BI Desktop or Service. Start by identifying a "master report," which is the main report from which you’ll drill through to others.
- Creating a Target Page: Create a new report page that will serve as the destination for your Drillthrough. This page should contain all the relevant visuals and data for the entity you're analyzing. For example, if you're examining data related to a manufacturer, you might include visuals like total units shipped, sales by region, or sales by category.
- Enabling Drillthrough: On your target page, add the specific field you want to focus on to the Drillthrough filters area. This setup ensures that when you drill through, you're taken to a page tailored to the specific item or entity you're analyzing.
How to Drill Through
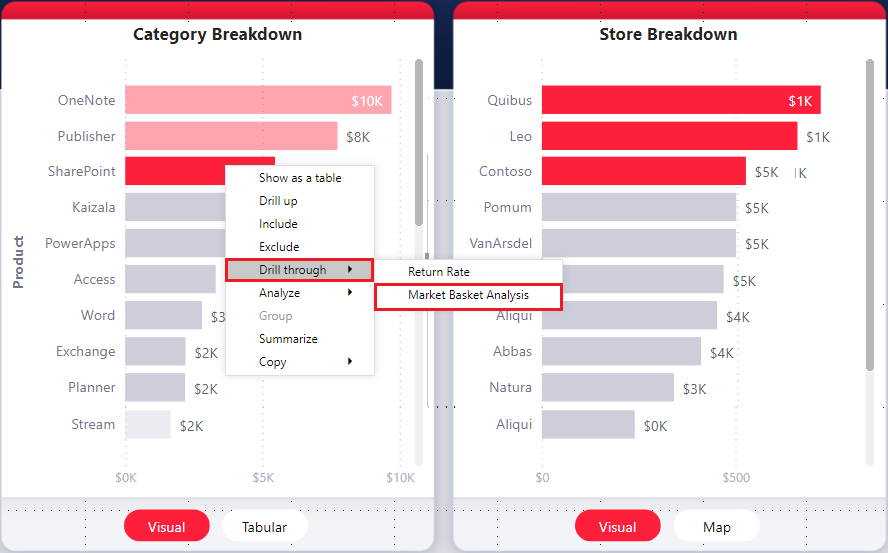
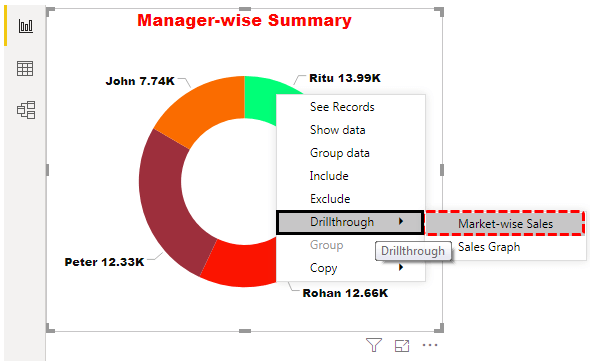
- Drilling Down: In your master report, simply right-click on the data point or entity you're interested in. From the context menu, select "Drill through" and choose the target page you set up earlier. This action redirects you to the page with detailed visuals and data about your selected entity.
- Enhancing Navigation: Power BI automatically includes a back button on the Drillthrough pages, allowing users to easily navigate back to the main report. You can customize this button with an image of your choice by adding it from the Home tab and setting the action type to "Back."
Keeping Context with Filters
One significant advantage of using Drillthrough is the ability to retain context through filters. If you have set filters on your main report—like focusing on a specific product category—these can carry over when you use Drillthrough. This continuity ensures that you maintain the same analytical perspective, providing consistency across your reports.
- Preserving Filters: To keep all applied filters when using Drillthrough, activate the "Keep all filters" option in the Drillthrough section of the visualization panel.
Maximizing Insights with Drillthrough
Using the Drillthrough feature in Power BI enables more granular analysis without losing sight of the bigger picture. It enhances the interactivity of your reports, making them not only more informative but also more engaging for users who need to understand specific facets of the dataset.
Drillthrough is not just about providing more data; it's about providing the right data in a clear and accessible way. Whether you're a business analyst, data scientist, or someone who needs to report on data regularly, mastering Drillthrough will undoubtedly add depth and precision to your data exploration tasks.
By integrating these detailed views seamlessly within your overall data narrative, Power BI's Drillthrough feature ensures that your reports are not just collections of data, but powerful tools for insight and action.
Do you have specific insights you're aiming to discover with Power BI's Drillthrough? Share your goals and challenges in the comments below, and subscribe to our newsletter for more tips on making the most of your data with Power BI!