
What are field parameters in Power BI?
Field parameters in Power BI allow users to select the columns they want to analyze in a visual using a slicer. This feature enables dynamic modification of visuals to display specific dimensions or metrics from the dataset.
- Field parameters are useful for datasets with many columns.
- They let report viewers customize and interact with visuals without changing the data model.
- Note: Field parameters are a preview feature in Power BI. Microsoft tests new features in preview mode before full release. Enable them in settings if they are not visible.
Why should you use this feature?
- Create interactive reports with dropdowns, checkboxes, and buttons to select columns.
- Simplify reports and enhance performance by reducing the number of visuals.
- Enhance the user experience by allowing users to access specific data.
Field parameters improve user experience, flexibility, and interactivity in your reports.
How to Create Field Parameters in Power BI
Field parameters in Power BI let users select columns to analyze using a slicer, allowing dynamic modification of visuals.
Step 1: Enable Field Parameters
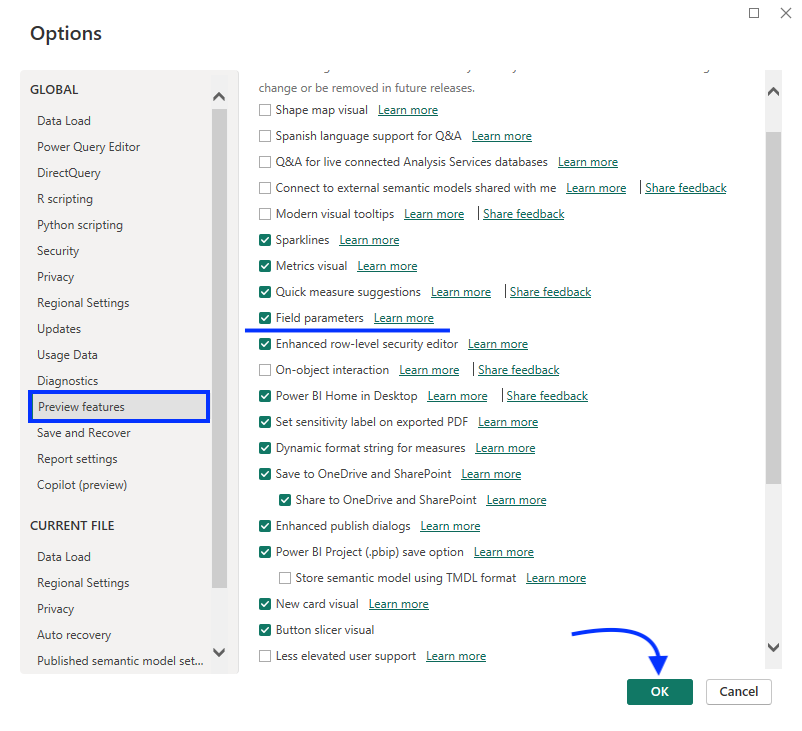
1. Open Power BI Desktop and go to Options and Settings.
2. Navigate to Options > Global > Preview features.
3. Check “Field parameters” and click OK.
- Apply transformations: Use the tools in the editor to clean and shape your data.
Step 2: Define a New Field Parameter
1. Add data to your report.
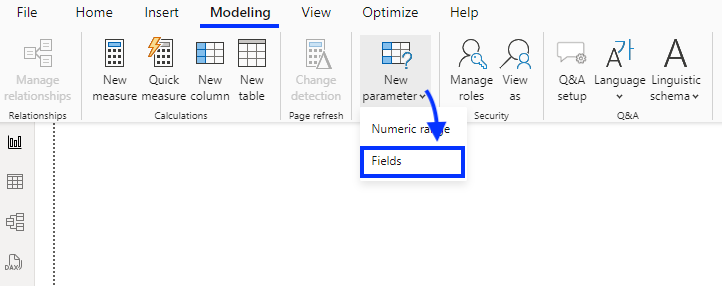
2. Go to the Modeling tab, click New parameter, and select Fields.
3. Name the parameter.
4. Select dimensions and metrics from the Fields section.
5. Check the box to add a slicer to the report.
6. Click Create.
This creates a field parameter table in the data pane using DAX expressions.
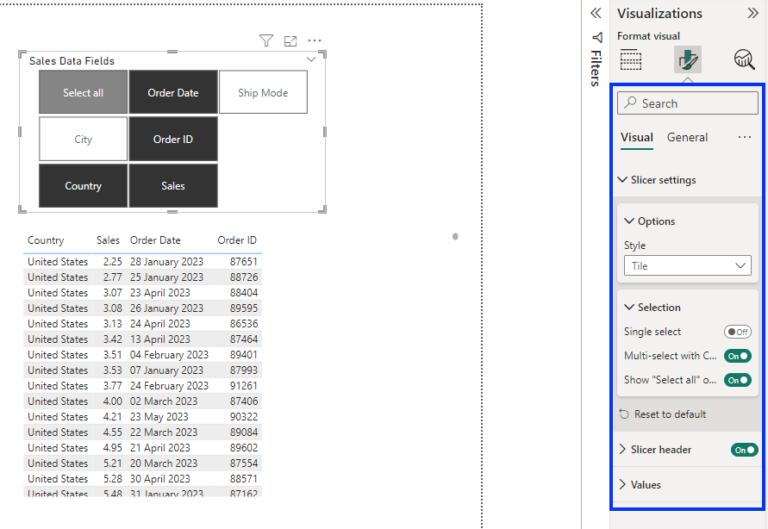
Step 3: Use the Field Parameter in Visuals
1. Build a dynamic visual using the field parameter.
2. Use the slicer to interact with the visuals and display specific fields.
3. Adjust the slicer’s appearance via Visualizations > Format visual, selecting the Tile style or applying conditional formatting.
Conclusion
Field Parameters in Power BI are a powerful feature that enhances the flexibility and interactivity of your reports. By allowing users to switch between different measures and dimensions, you can create dynamic and user-friendly reports. Follow the steps and examples in this guide to start using Field Parameters effectively in your Power BI projects.