
What is Power BI?
Power BI is a business analytics service by Microsoft that helps you turn data into clear, visually immersive, and interactive insights. Whether your data is in an Excel spreadsheet or a collection of cloud-based and on-premises hybrid data warehouses, Power BI can connect to various data sources, transform and clean the data, and let you discover what's important.
Power BI provides interactive visualizations and business intelligence capabilities, allowing users to easily create their own reports and dashboards. Additionally, Power BI enables sharing and collaboration across organizations, helping teams make data-driven decisions together.

Why Use Power BI?
- User-Friendly: Power BI has a simple and intuitive interface, making it accessible for beginners.
- Versatile: It connects to many data sources like Excel, databases, and cloud services.
- Interactive Visuals: Create dynamic and interactive reports that can be easily shared.
Setting Up Power BI
- Download and Install Power BI Desktop: Go to the official Power BI website, download the desktop application, and follow the installation steps.
- Sign Up for Power BI Service: Create an account on the Power BI website to access online services.
- Get the Mobile App: Available on both iOS and Android for on-the-go access.
Connecting to Data Sources
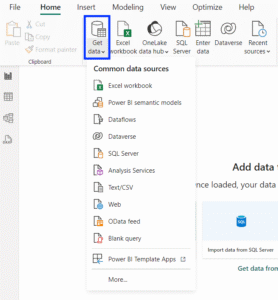
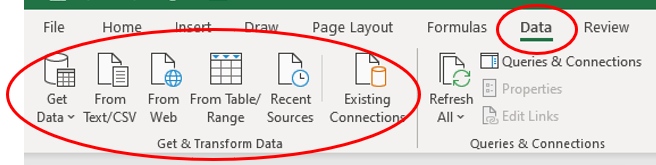
Power BI can connect to many different data sources, including Excel files, SQL databases, and online services. Here's how to connect to a data source:
- Open Power BI Desktop.
- Click on "Get Data"
- Choose your data source: Select from the list of available sources and follow the prompts to connect.
To use Power Query:
- Click on "Transform Data": This opens the Power Query Editor.
- Apply transformations: Use the tools in the editor to clean and shape your data.
Transforming Data with Power Query
Power Query is a tool within Power BI that lets you clean and transform your data. Some common transformations include:
- Removing duplicates
- Filtering rows
- Changing data types
- Merging tables
Creating Your First Report
Building Visuals
Power BI offers a variety of visualizations, such as bar charts, line graphs, and maps. To create a visual:
- Select a visual: Choose a visual from the Visualizations pane.
- Drag fields to the visual: From the Fields pane, drag data fields onto the visual to populate it.
Customizing Visuals
You can customize your visuals to make them more informative and visually appealing:
- Change colors and styles
- Add titles and labels
- Adjust axes and scales
Adding Filters and Slicers
Filters and slicers help you control what data is displayed in your visuals:
- Filters: Apply filters to individual visuals or the entire report.
- Slicers: Add slicers to let users interactively filter data.
Sharing Your Reports
Publishing to Power BI Service
Once your report is ready, you can share it with others by publishing it to the Power BI service:
- Click "Publish": This button is on the Home tab.
- Sign in to Power BI: Use your Microsoft account to sign in.
- Choose a workspace: Select where you want to publish your report.
Creating Dashboards
In the Power BI service, you can create dashboards by pinning visuals from your reports:
- Open your report: In the Power BI service.
- Pin visuals: Click on the pin icon to add visuals to a new or existing dashboard.
Sharing Dashboards
Share your dashboards with colleagues to collaborate and share insights:
- Open your dashboard.
- Click "Share"
Advanced Features
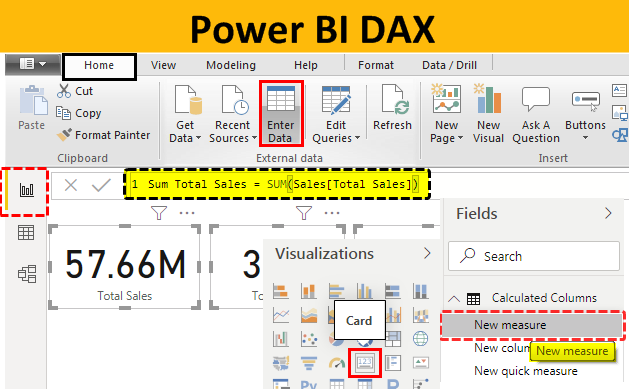
Using DAX for Calculations
DAX (Data Analysis Expressions) is a formula language for creating custom calculations in Power BI. Some basic DAX functions include:
- SUM: Adds up values in a column.
- AVERAGE: Calculates the average of values in a column.
- IF: Creates conditional calculations. Creates conditional calculations.
To create a DAX measure
- Click on "New Measure": This button is on the Modeling tab.
- Enter your DAX formula: Use the formula bar to write your calculation.
Working with Power BI Mobile
Power BI also offers a mobile app for viewing reports and dashboards on the go. Download the app from your device's app store and sign in with your Power BI account to access your reports.
Integrating with Other Microsoft Tools
Power BI integrates seamlessly with other Microsoft tools like Excel, SharePoint, and Teams. This integration allows you to:
- Import data from Excel spreadsheets
- Embed reports in SharePoint pages
- Share insights in Teams channels
Tips for Mastering Power BI
- Stay Updated: Microsoft regularly updates Power BI with new features. Stay informed about the latest updates.
- Join the Community: Engage with the Power BI community through forums, blogs, and social media. Subscribe to our newsletter for Power BI updates: “Beehiiv Link”
- Practice Regularly: The best way to master Power BI is through regular practice. Work on different projects to enhance your skills.
Conclusion
Power BI is a versatile tool that can transform how you work with data. By following this guide, you can start with the basics and gradually master advanced features. Remember to stay curious and keep exploring new ways to leverage Power BI for your data analysis needs.
With practice and dedication, you'll become proficient in creating insightful and interactive reports that drive better decision-making for your organization.