Introduction
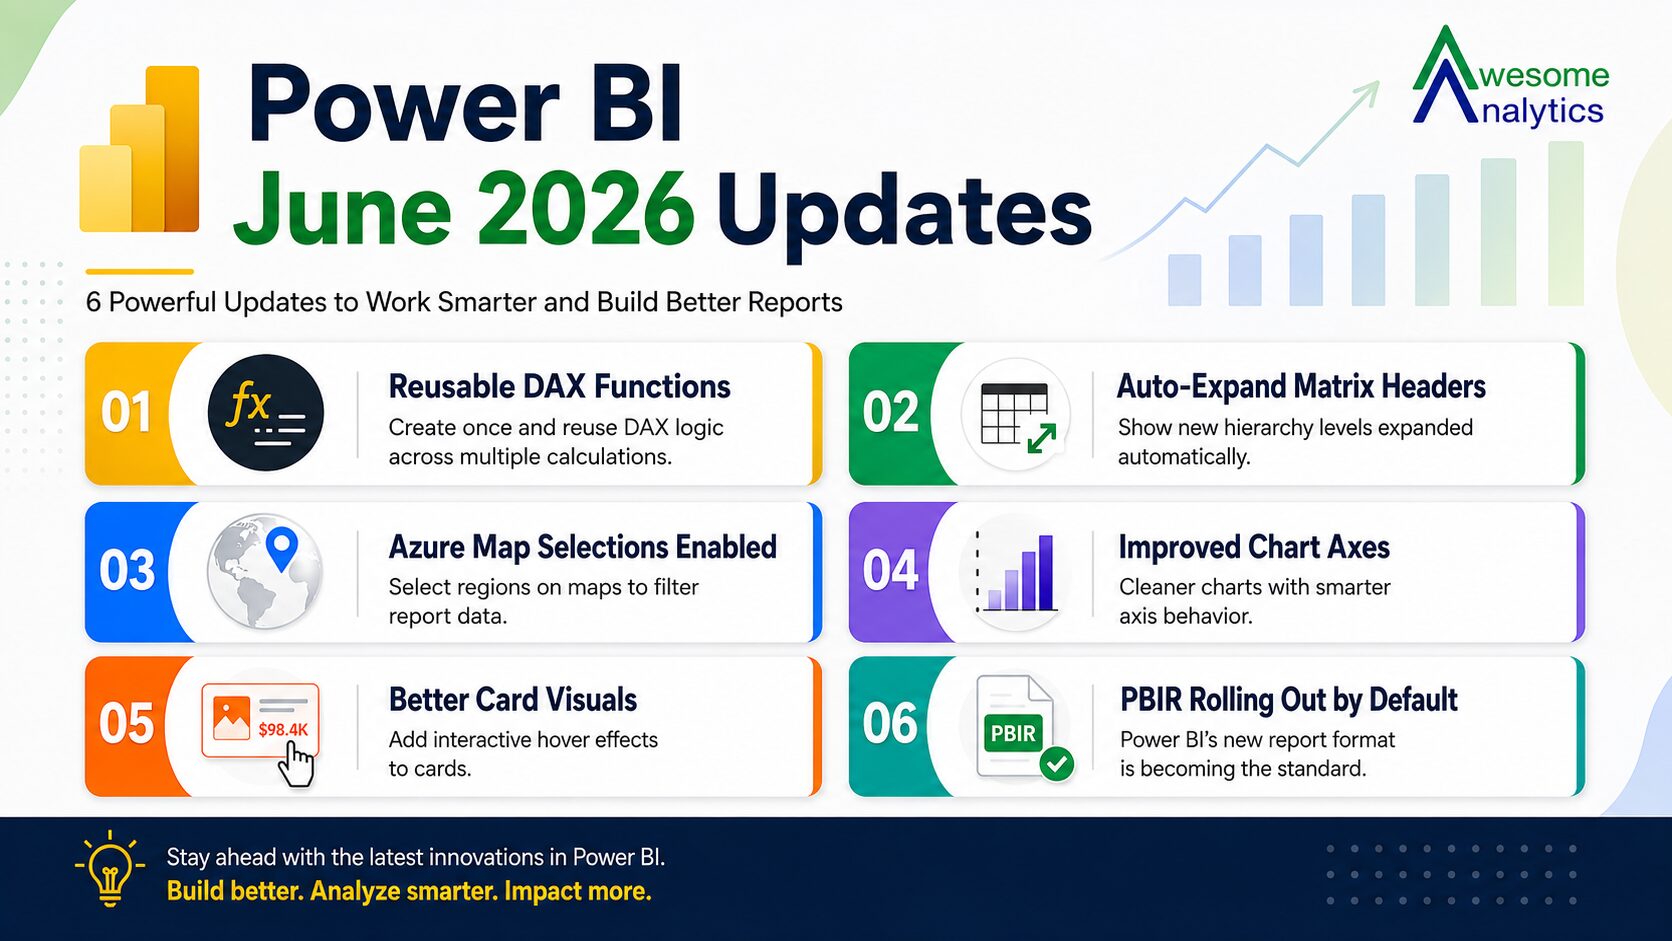
June 2026 is one of the bigger Power BI release months. Microsoft confirmed general availability for ten features across reporting and modeling, added Power BI tab support for Teams private and shared channels, and has significant Copilot and AI features rolling out in preview. Here is what is available now and what is still coming.
Reporting Updates
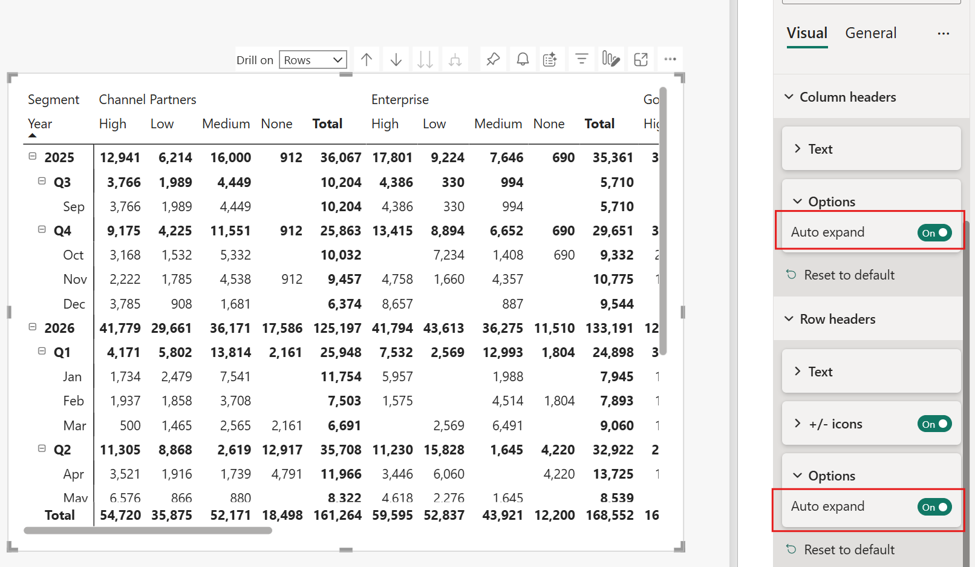
Auto-expand for Matrix Row and Column Headers
Matrix visuals now let you control whether new hierarchy levels appear expanded or collapsed by default. Particularly useful for reports using Personalise This Visual, where previously any field a viewer added defaulted to collapsed and required manual clicking through each level.
Axis Improvements for Bar and Column Charts
A new Rounded Range option removes extra axis padding so the value axis starts flush with your data. Adding data labels no longer shifts the axis range, keeping visuals consistent whether labels are on or off.
Slicer Visual Selection Icon Color Formatting
Customise the checkbox or radio button colour in slicers to work with dark themes or brand colours. Previously fixed, now fully adjustable from the format pane.
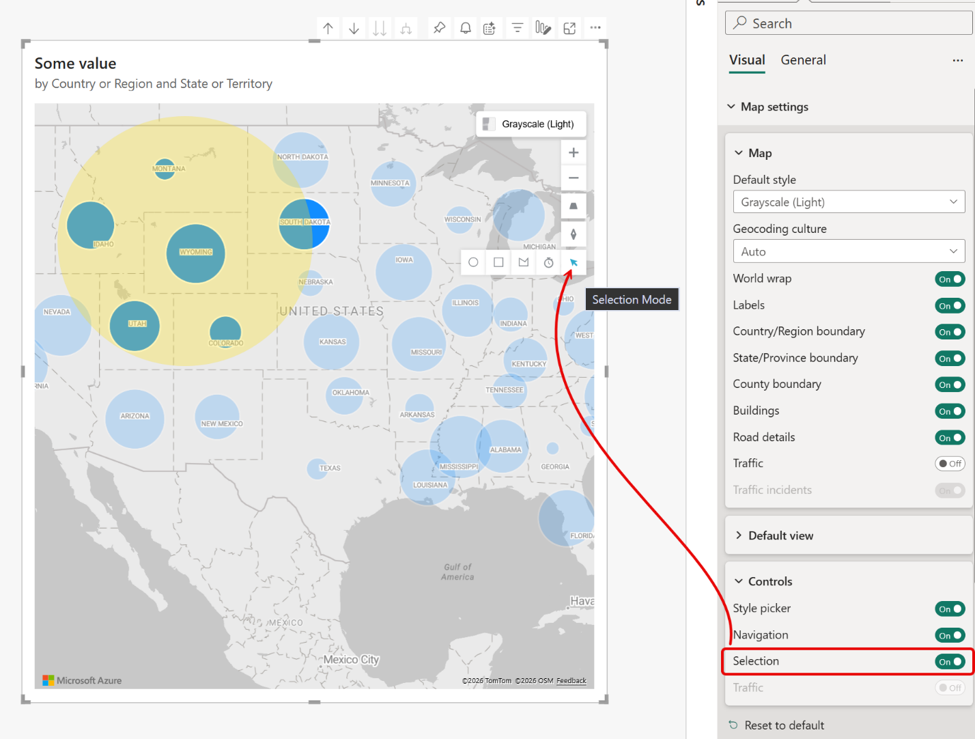
Azure Map Selections On by Default
Selection controls are now turned on by default in the Azure Maps visual. Users can draw a circle, rectangle, or freeform polygon to select geographic data points and filter other visuals. Previously this existed but was off by default, meaning most users never discovered it.
Tooltip Options
Configure tooltips to explain data in plain sentences rather than just showing values. A sentence mode in the format pane lets you write context directly and reference tooltip fields without building a custom tooltip page or writing any DAX.
Modeling Updates Now Generally Available
DAX User-Defined Functions
Define a calculation once and reuse it across measures, calculated columns, and visual calculations. UDFs support optional parameters, automatic dependency tracking when objects are renamed, and can be saved as TMDL files in Git-integrated workspaces for team-wide reuse.
DAX Query View Results Grid: Filtering and Sorting
The DAX query view results grid now includes sort and filter controls on column headers. Sort, filter by specific values, or search within results without rewriting your DAX. Useful when debugging expressions or validating output.formatting across regions or teams matters.
Collaboration Update
Power BI in Teams: Now Available in Private and Shared Channels
Power BI report tabs can now be added to private and shared channels in Microsoft Teams, not just standard channels. Teams can view and interact with reports directly alongside conversations without switching applications
What Is Still Coming
Several features are in preview or limited access this month and worth keeping an eye on. The Date Picker for Slicers solves the exact problem in the hook above: set a relative date once, publish, and it rolls forward automatically as data refreshes.
Copilot in Web Modeling lets you analyse and improve semantic models through natural language, including renaming objects, creating relationships, and generating DAX measures. AI-Powered Report Authoring with Agent Skills lets you build complete reports through conversation across five stages from planning to publishing, currently limited to local PBIP files.
Data Answering in Fabric Skills, Cowork and M365 Chat brings Power BI data into everyday tools so users can ask plain language questions without navigating reports, currently available to Frontier users only.
Conclusion
June 2026 addresses specific friction points that Power BI users encounter regularly: slicers that need manual resetting, axes that shift when labels are added, maps that hide selection tools, tooltips that only show numbers. The preview features signal where the product is heading next: AI-assisted report building and natural language data access inside tools people already use daily.
If you want updates like these in your inbox every week, subscribe to the Awesome Analytics newsletter.